The Geometry, History, and Maths of Family Trees
Tracing your ancestry is a deeply personal and rewarding journey. It takes countless hours of deciphering old census records, translating birth certificates, and piecing together a massive historical puzzle. But once you have successfully mapped out your lineage, you face a surprising logistical hurdle: How do you actually display all this information as a beautiful print piece or a readable document?
When genealogists attempt to transform their digital data into a physical print, they immediately run into a war between graphic design and mathematics. Here is why the traditional family tree shape is a nightmare to print, the fascinating history behind the numbering system that powers it, and why the circular family tree is the ultimate solution for your home.
The Print Problem: The Sprawl of the Inverted Pyramid
For centuries, the default visual representation of a lineage has been the hierarchical tree, often displayed as a horizontal bracket or an "inverted pyramid". Starting from a single point (you) at the bottom or side, the branches move outward to two parents, four grandparents, eight great-grandparents, and so on.
Whilst this makes logical sense on a digital screen where you can click and drag, it suffers from a fatal flaw in the physical world: exponential growth.
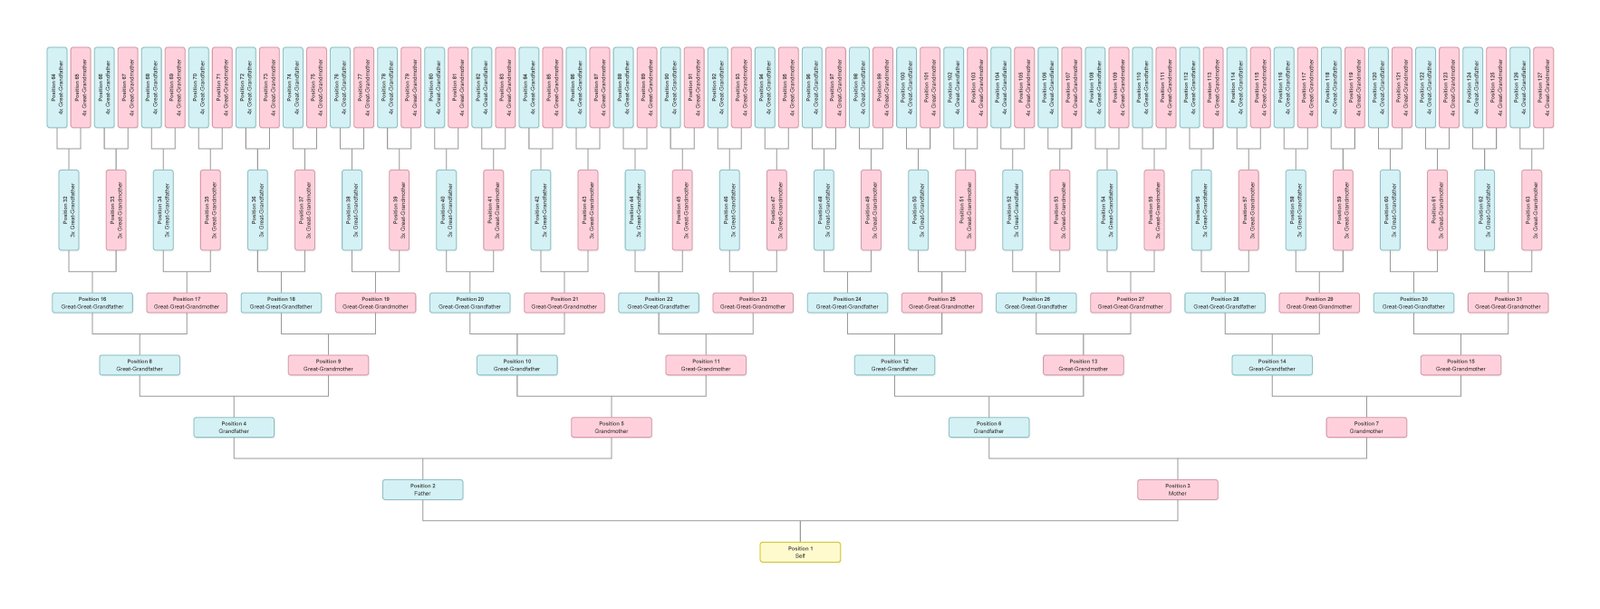
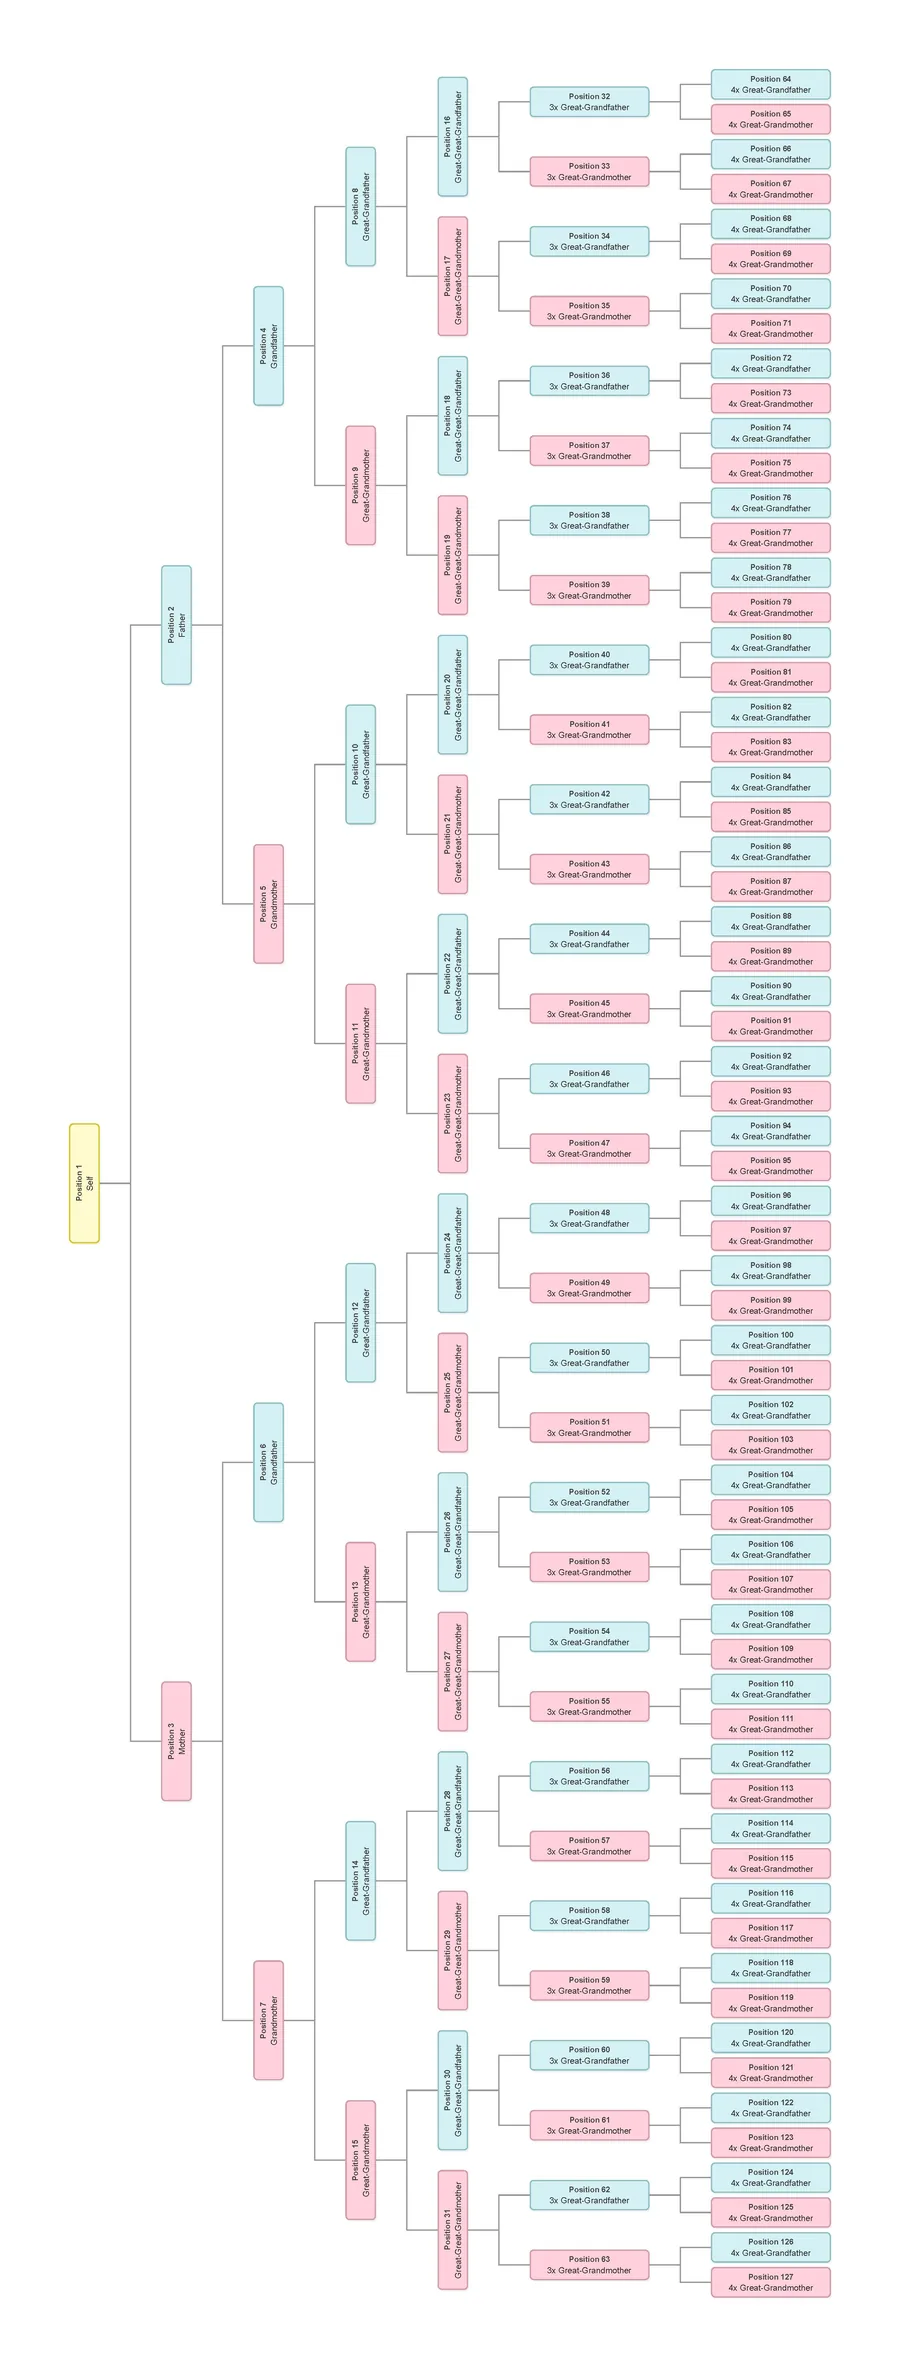
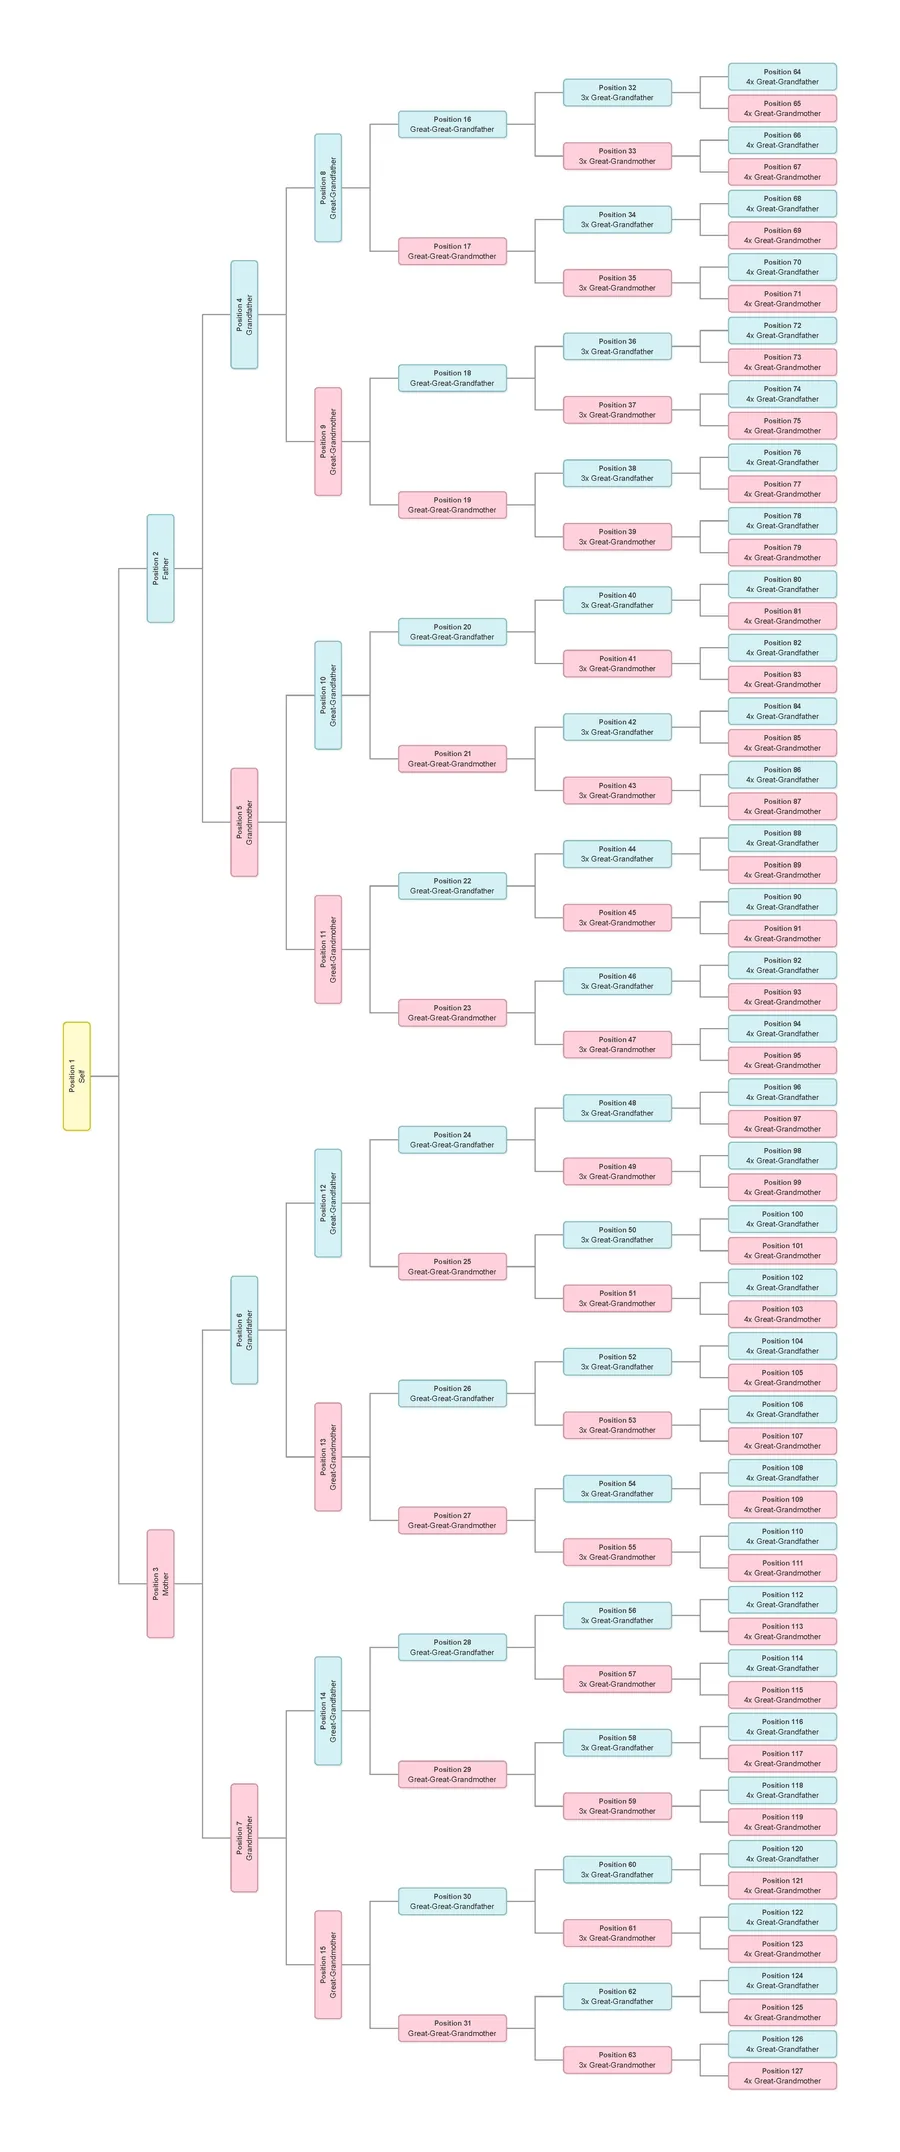
Every generation you go back, the number of ancestors doubles. By the time you reach your 7th great-grandparents (just 9 generations back), you are trying to fit 512 individuals onto a single edge of the paper.
When you try to print this hierarchical pyramid, you face insurmountable design compromises:
- The Endless Scroll: To fit hundreds of boxes horizontally whilst keeping the text readable, the physical document must become incredibly wide—turning into an unwieldy, ten-metre-long banner.
- The Microscopic Squeeze: If you try to force that layout onto a standard poster size, the font must shrink to microscopic, unreadable proportions.
- Wasted Space: Because the starting generations feature only one, two, or four people, the vast majority of the paper near the root individual is left completely blank, whilst the opposite edge is a crammed traffic jam of text.
- Framing Nightmares: A sprawling hierarchical tree requires wildly expensive, custom-built panoramic frames that look more like a corporate flowchart than a treasured fine art print.
The Elegance of the Circular Compact Chart
The solution to the exponential growth problem is geometry: the circular family tree (often called a fan chart).
Instead of fighting exponential growth, the circular chart embraces it. As seen in the positional diagram below, the starting individual or couple is placed in the centre, and the generations radiate outward in 360 degrees.
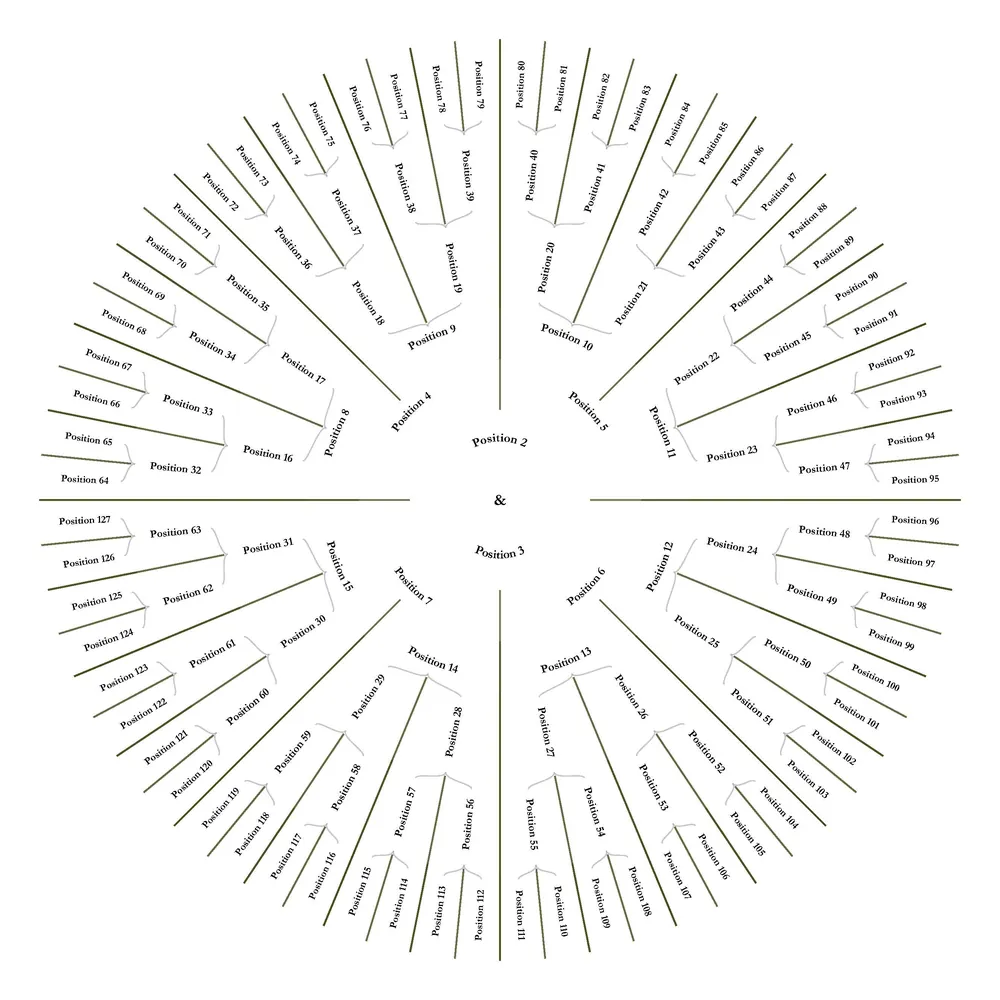
Why the circular layout is dramatically superior for print:
- Geometric Harmony: As you move outward from the centre, the circumference of a circle naturally gets larger. This perfectly provides the increased physical space needed to accommodate your doubling ancestors without stretching the canvas.
- Maximum Legibility: Because it utilises the entire canvas rather than leaving dead white space, the text can remain large and readable much further back into your history.
- Standard Framing: A radial chart naturally forms a square. This means a sweeping 7- or 8-generation tree can easily fit inside a standard, affordable picture frame.
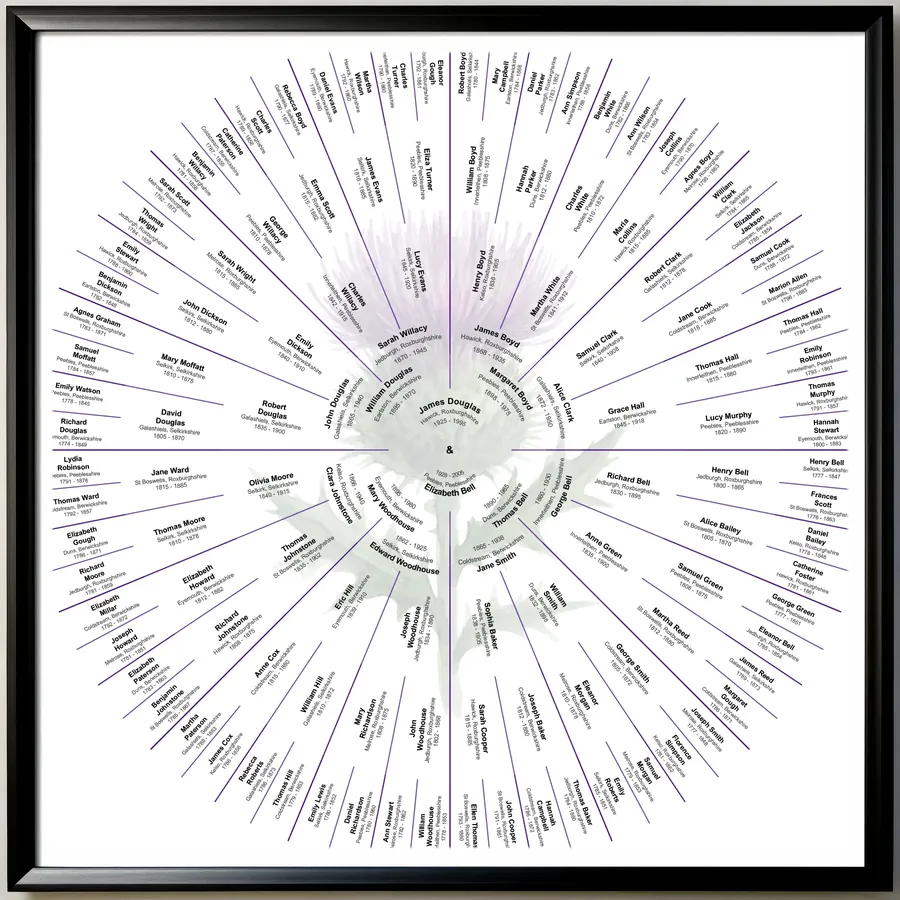
As shown in the finished framed piece below, the circular layout mimics organic shapes—like a sunburst or the rings of an ancient tree. It elevates raw genealogical data into a breathtaking, symmetrical piece of modern art.
The Secret Maths of Ancestry: The Ahnentafel System
Whether a tree is printed as a clunky pyramid or a sleek circle, you will notice a numbering system assigned to every position. This isn't a random count; it is a globally recognised mathematical standard called the Ahnentafel Numbering System.
The History:
"Ahnentafel" is a German word translating to "ancestor table". The system was first conceptualised by an Austrian historian named Michaël Eytzinger in 1590 to map the complex, sprawling lineages of European royal houses. It was later adopted in 1676 by the Spanish genealogist Jerónimo de Sosa, and finally formalised and popularised globally in 1898 by Stephan Kekulé von Stradonitz. Because of this, it is sometimes called the Sosa-Stradonitz Method.
The Method:
The brilliance of the Ahnentafel system lies in its simple, unbreakable mathematical rules that instantly identify a person’s exact relationship to the root individual, without ever needing to draw a connecting line:
- 1. The Subject
- The root individual is always designated as Number 1.
- 2. The Father Rule
- A father's number is always exactly double his child's number (2n). For example, Person 1's father is 2. Person 12's father is 24.
- 3. The Mother Rule
- A mother's number is always double her child's number, plus one (2n + 1). For example, Person 1's mother is 3. Person 12's mother is 25.
Because of these brilliant maths, all men will always have even numbers, and all women will always have odd numbers (with the exception of Position 1). If you are looking at ancestor #84, you instantly know they are male, their child is #42, and the female parent is #85.
How Family Tree Software Utilises This Maths
When you use modern genealogy software or websites, you rarely have to manually draw lines between relatives. How does the software handle thousands of intersecting relatives so effortlessly?
Computers struggle with vague, text-based concepts like "great-great-grandfather", but they excel at maths. These platforms utilise the Ahnentafel numbering system as their core database architecture.
When you enter a new ancestor, the software assigns them an Ahnentafel index number. When you click "Export to Chart", the software doesn't have to guess where to draw the boxes. It simply runs a lightning-fast mathematical algorithm: it pulls person #1, applies the 2n and 2n+1 maths to find the parents, automatically drops them into the corresponding numbered slots, and loops the maths for the next generation.
This flawless mathematical foundation is exactly what allows software programmes to seamlessly take your text-based data and instantly map it into the interlocking wedges of a printable chart.
Bring Your History Full Circle
Your family history is a masterpiece centuries in the making. It shouldn't be trapped in a digital database, nor printed on an unwieldy, unreadable paper scroll. By choosing a circular family tree design, you conquer the geometry of exponential generations. You transform a chaotic web of data into a compact, perfectly balanced, and highly readable layout.
Don't hide your heritage in a sprawling flowchart. Display it beautifully. Upgrade to a circular family tree today, frame your legacy, and turn your history into a stunning focal point that will captivate your family for generations to come!